
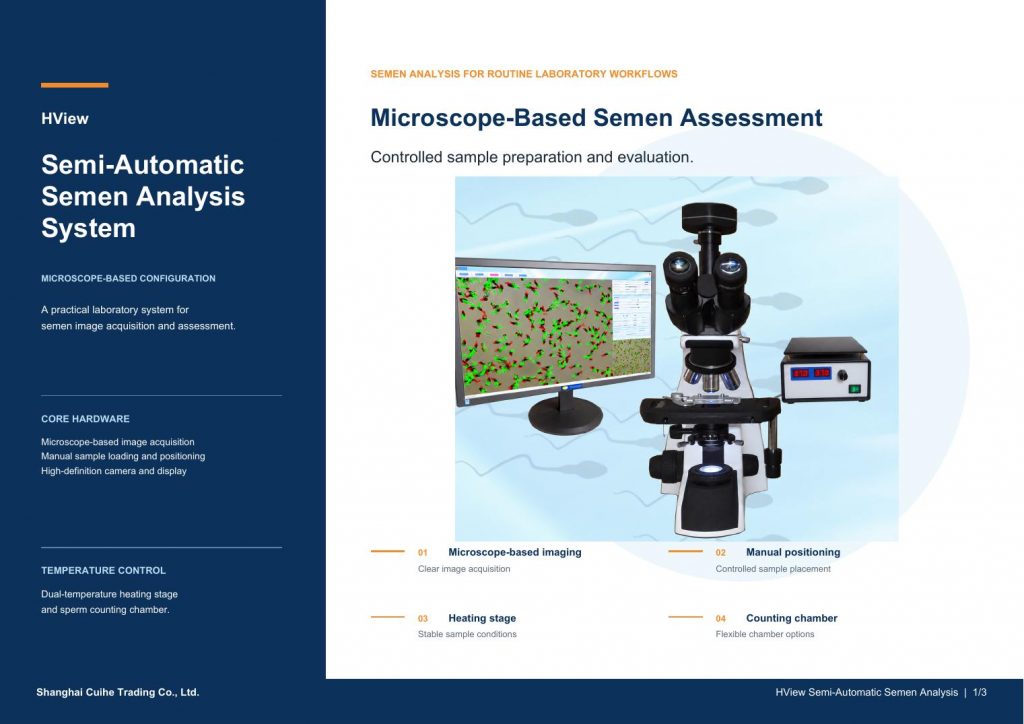
HView Semi-Automatic CASA System
The HView Semi-Automatic CASA System is designed for routine semen evaluation in animal-breeding laboratories. It combines microscope imaging, a dual-temperature sample stage and dedicated analysis software in one practical workflow.
CASA, or Computer-Assisted Semen Analysis, uses microscopic image data to assess sperm concentration, motility and related movement parameters. In the HView semi-automatic system, samples are loaded and positioned manually before image capture. The live image is displayed on screen, and the software records and presents the analysis results.
Key Features
- Microscope-based imaging with manual sample loading and positioning
- Dual-temperature stage for the sample chamber and preparation area
- Analysis of sperm concentration, motility, velocity and motility-grade distribution
- Morphology assessment with normal and abnormal form classification and defect statistics
- Breeding-animal record management, including identification details and photographs
- Search, review, reporting and export of historical test records
Analysis and Record Management
The system provides on-screen results from the microscopic image. Dynamic analysis covers concentration, motility, velocity and motility-grade distribution. Morphology analysis classifies normal and abnormal sperm forms and provides defect statistics.
Breeding-animal records and historical test data can be stored and retrieved within the software. Users can review previous results, generate reports and export test data when required.
Technical Parameters
Temperature stage: Dual-temperature preheating platform and heating plate
Temperature setting: Room temperature to 50 °C
Temperature-control deviation: No greater than 0.01 °C, as stated in the brochure
Counting chambers: 4, 6 or 8 options; 10, 15 or 20 μm chamber depths
Detection range: 0–2,000 sperm per image / field of view
Image resolution: 768 × 576 standard, or 1280 × 960 high definition
Minimum capture interval: 0.04 s standard, or 0.0315 s high definition
Typical analysis time: 2–5 s per group in standard mode; 2–8 s in high-definition mode
Specifications are based on the supplied brochure and may vary with the final configuration.